
Lean Manufacturing Principles
Lean Manufacturing is a systematic approach to identifying and eliminating waste through continuous improvement, flowing value to the customer with minimal resources. In the context of the Certificate in Production Planning and Control, und…
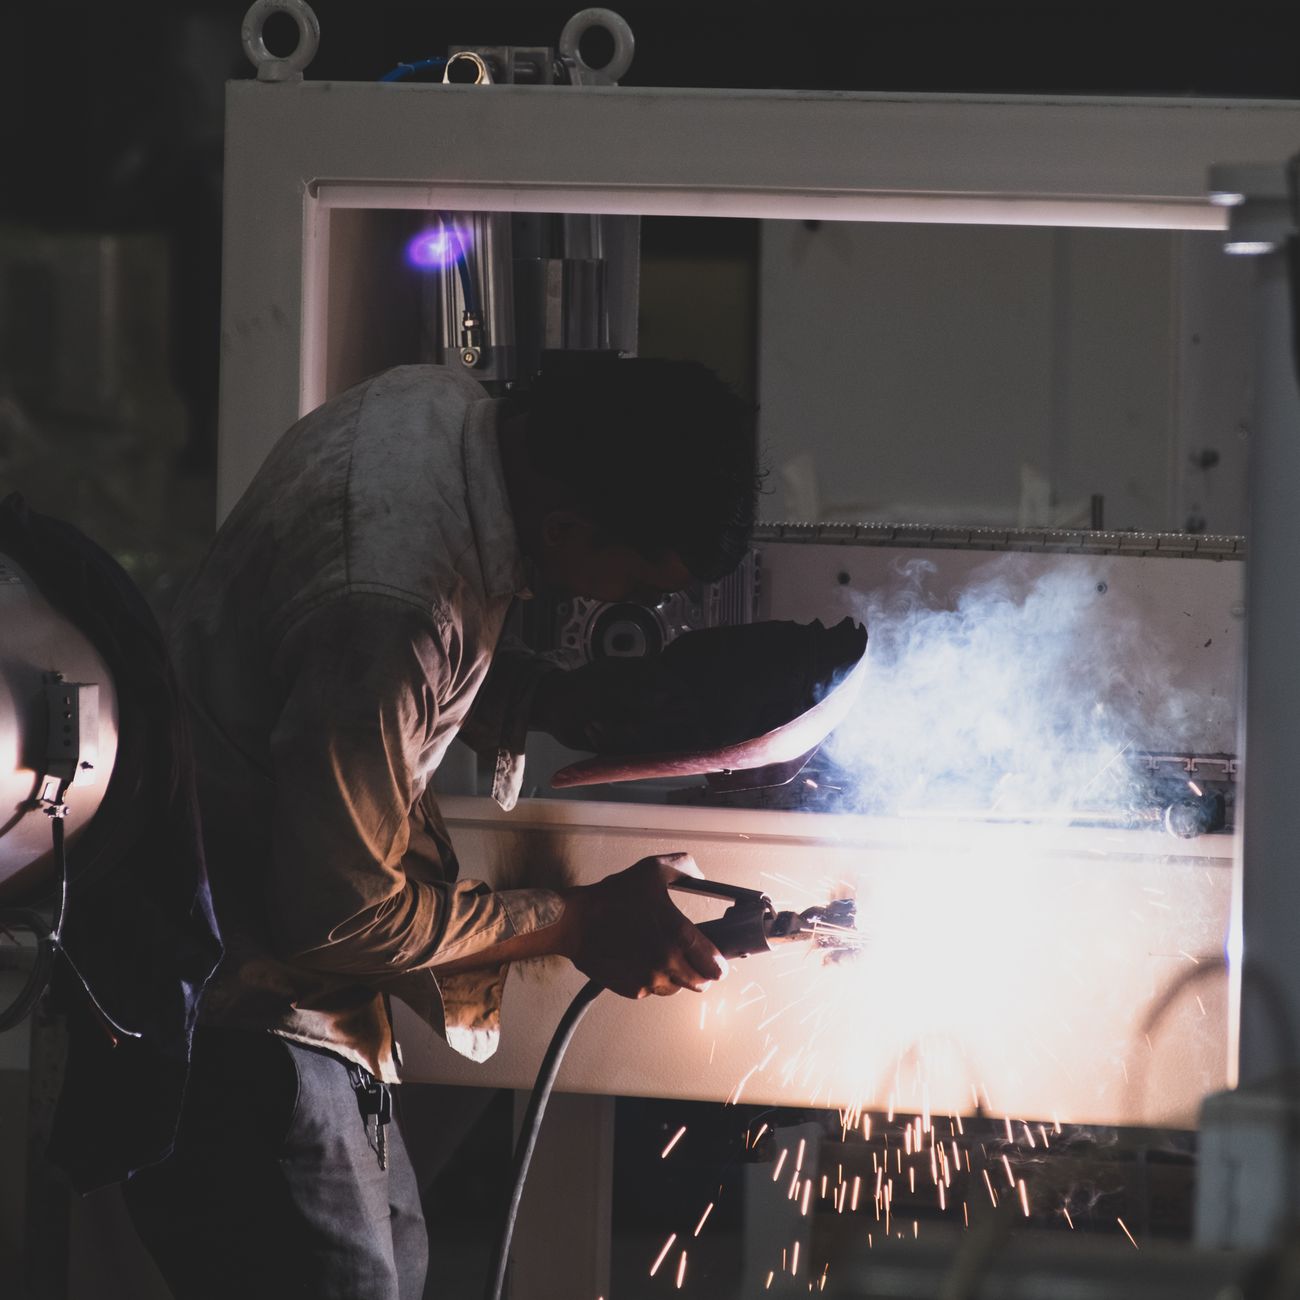
Lean Manufacturing is a systematic approach to identifying and eliminating waste through continuous improvement, flowing value to the customer with minimal resources. In the context of the Certificate in Production Planning and Control, understanding the specific vocabulary associated with lean principles is essential for designing efficient production systems, planning operations, and managing resources effectively. The following explanation covers the most frequently encountered terms, providing definitions, practical examples, typical applications, and common challenges faced by practitioners in the United Kingdom.
Value refers to any activity or feature that a customer is willing to pay for. In production planning, distinguishing between value‑adding and non‑value‑adding activities enables planners to focus resources on processes that directly contribute to the final product. For example, assembling a gearbox adds value because the customer receives a functional component, whereas moving the partially assembled gearbox between distant workstations may not add value if it does not improve quality or speed. A common challenge is that managers sometimes mistake “necessary” for “value‑adding,” leading to over‑processing and inflated costs.
Waste (or muda) is any activity that consumes resources without creating value. Lean identifies seven classic types of waste, often expanded to eight or nine in modern practice. Each type is described below with an illustrative scenario.
1. Transportation – Unnecessary movement of materials or products. A UK automotive parts supplier might transport stamped metal sheets across a large floor before cutting them, adding handling time without improving the product. Reducing transportation often involves re‑layout of the shop floor or adopting cellular manufacturing.
2. Inventory – Excess raw material, work‑in‑process (WIP), or finished goods. Holding large stocks of steel rods to guard against supply disruptions can mask underlying scheduling problems and increase holding costs. Implementing pull systems helps keep inventory at optimal levels.
3. Motion – Unnecessary motions of people, such as reaching, bending, or walking. An operator who must walk to three different tool stations to complete a sub‑assembly spends valuable time on motion rather than on the assembly itself. Ergonomic workstation design reduces motion waste.
4. Waiting – Delays caused by waiting for materials, information, or equipment. A CNC machine may sit idle waiting for a program change, extending lead time. Synchronising processes through takt time planning reduces waiting.
5. Over‑production – Producing more than is required or before it is needed. A printer that produces 10,000 leaflets when only 7,000 are ordered creates excess inventory and ties up paper and ink. Implementing a pull‑based schedule aligns output with actual demand.
6. Over‑processing – Adding features or steps that the customer does not need. Applying a high‑gloss finish to a component that will be painted later adds no value and creates rework. Value‑stream mapping helps identify and eliminate over‑processing.
7. Defects – Production of defective items that require rework or scrap. A faulty bearing that must be replaced adds cost and delays downstream operations. Poka‑yoke devices and robust quality control can minimise defects.
Additional waste categories sometimes included are Unused talent – failing to leverage employee skills and ideas, and Energy – wasteful consumption of power or utilities. Recognising all forms of waste is the first step toward systematic elimination.
Value Stream is the sequence of activities required to design, produce, and deliver a product to the customer. Mapping the value stream provides a visual representation of material and information flow, highlighting both value‑adding steps and waste. In the UK, many manufacturers use value‑stream mapping to comply with industry standards such as ISO 9001 while pursuing lean objectives.
Value‑Stream Mapping (VSM) is a specific lean tool that captures the current state of a process, quantifies flow metrics, and designs a future state with reduced waste. A typical VSM includes symbols for process boxes, inventory triangles, data boxes (cycle time, changeover time, uptime), and a timeline showing material flow. For example, a food‑processing plant may map the flow from raw vegetable receipt to packaging, identifying a bottleneck at the blanching stage where changeover time is excessive. The future‑state map may propose SMED (Single‑Minute Exchange of Die) techniques to reduce changeover and balance the line.
Challenges in VSM include obtaining accurate data, gaining cross‑functional cooperation, and maintaining focus on strategic objectives rather than getting lost in detail. In many UK organisations, the involvement of senior management is crucial to ensure that VSM outcomes translate into actionable improvement projects.
Kaizen is the philosophy of continuous improvement, often expressed as “small, incremental changes.” A Kaizen event (or Kaizen blitz) may involve a cross‑functional team spending three days on the shop floor to improve a specific process, such as reducing the time to set up a CNC machine. The team uses tools like the “5 Whys” to uncover root causes and implements countermeasures. In the UK, Kaizen aligns with the “continuous improvement” clause of the ISO 9001 standard, encouraging organisations to document and review improvement actions regularly.
The main challenges in Kaizen implementation are sustaining momentum after the event and integrating improvements into standard work. Without proper follow‑up, gains may be lost, and employees may become sceptical of future initiatives.
5S is a workplace organisation method that creates an orderly, clean, and efficient environment. The five Japanese words are Seiri (Sort), Seiton (Set in order), Seiso (Shine), Seiketsu (Standardise), and Shitsuke (Sustain). In a UK electronics assembly line, Sort may involve removing obsolete components, Set in order could include colour‑coded tool racks, Shine involves daily cleaning, Standardise creates visual checklists, and Sustain requires regular audits. Successful 5S programmes reduce motion waste, improve safety, and make problems visible.
Common obstacles include resistance to change, lack of leadership commitment, and difficulty maintaining standards over time. To overcome these, organisations often appoint 5S champions and embed 5S audits into routine performance reviews.
Just‑In‑Time (JIT) is a production philosophy that seeks to produce and deliver items only when they are needed, in the exact quantity required, and at the right time. JIT reduces inventory holding costs and improves responsiveness to demand fluctuations. A UK automotive supplier may receive chassis components from a tier‑1 supplier the day they are needed on the assembly line, minimising floor space and capital tied up in stock.
Implementing JIT requires reliable suppliers, stable demand forecasts, and robust logistics. Any disruption in the supply chain, such as a strike at a port or a sudden change in demand, can cause production stoppages. Therefore, risk mitigation strategies such as dual‑sourcing and safety stock buffers are often incorporated.
Kanban is a visual signalling system used to control the flow of materials in a pull‑based production system. Kanban cards or electronic signals indicate when a downstream process needs more parts, prompting the upstream process to produce or supply them. For example, a metal‑stamping shop may use a two‑card kanban system: One card for each colour of material, and another for each product variant. When a bin is emptied, the corresponding kanban is pulled, triggering replenishment.
Key challenges include setting appropriate kanban quantities (too few cause stockouts; too many generate excess inventory) and ensuring that all participants understand the system. In many UK companies, kanban is integrated with ERP (Enterprise Resource Planning) systems, providing real‑time visibility of inventory levels.
Pull System is a production approach where each process produces only what is needed by the next downstream process, based on actual demand. This contrasts with a push system, where production is based on forecasts. Pull systems rely on tools such as kanban, takt time, and level scheduling to synchronise activities. A retailer of home appliances may use a pull system to assemble washing machines only after a customer order is confirmed, reducing finished‑goods inventory.
The main difficulty with pull systems is achieving the required level of synchronisation, especially when demand is highly variable. Companies often combine pull with demand‑forecasting techniques to balance flexibility and stability.
Push System drives production based on forecasted demand, often leading to excess inventory and higher lead times. While push systems can be appropriate for products with long lead times and stable demand, they are generally less efficient than pull systems for high‑mix, low‑volume environments common in many UK manufacturing sectors.
Takt Time is the rate at which a finished product must be produced to meet customer demand. It is calculated by dividing available production time by the required units. For instance, if a factory operates 480 minutes per shift and must produce 240 units, the takt time is 2 minutes per unit. Takt time serves as a pacing mechanism, aligning the rhythm of production with market demand.
Challenges in applying takt time include accounting for breaks, maintenance, and variability in process times. Planners often use a buffer or allowance in the calculation to accommodate unavoidable disruptions.
Cycle Time measures the total time required to complete one unit of work at a particular workstation, from start to finish. It includes processing time, but excludes waiting or idle periods. Reducing cycle time can increase throughput and improve responsiveness. However, focusing solely on cycle time without considering quality may lead to rushed work and higher defect rates.
Lead Time is the total elapsed time from the receipt of a customer order to the delivery of the finished product. Lead time encompasses order processing, production, inspection, and logistics. In a lean environment, the goal is to minimise lead time to enhance customer satisfaction and reduce work‑in‑process inventory. Techniques such as cross‑training, parallel processing, and reducing batch sizes contribute to lead‑time reduction.
One common challenge is the “hidden lead time” that occurs in non‑value‑adding activities such as paperwork or approvals. Streamlining information flow and automating data capture can help expose and eliminate these hidden delays.
Setup Time is the period required to prepare a machine or work centre for a new production run. Long setup times increase batch sizes and inventory, as manufacturers try to amortise the setup cost over more units. Reducing setup time enables smaller batches and more flexible production.
SMED (Single‑Minute Exchange of Die) is a structured methodology for dramatically reducing setup times. The process involves separating internal (performed while the machine is stopped) from external (performed while the machine is running) setup activities, then converting internal tasks to external wherever possible, and finally streamlining all steps. A UK metal‑forming shop may reduce a die change from 45 minutes to under 10 minutes, allowing a shift from weekly to daily production runs.
Implementation challenges often include resistance from operators who view the changes as “extra work,” and the need for specialised tools or fixtures. Successful SMED projects typically involve strong leadership support and a clear demonstration of the financial benefits.
Continuous Flow describes a production layout where each product moves smoothly from one operation to the next without waiting or batching. This contrasts with batch processing, where multiple units are processed together before moving on. Continuous flow reduces WIP, shortens lead time, and improves quality by exposing problems early.
Designing a continuous‑flow line requires careful analysis of process times, layout, and equipment capabilities. In many UK small‑to‑medium enterprises (SMEs), space constraints make continuous flow challenging, but the use of modular workstations and flexible tooling can overcome these limitations.
Cellular Manufacturing groups machines and workstations into self‑contained cells that produce a family of similar parts. Each cell operates as a mini‑production line, often using a pull system to feed downstream processes. Cellular layouts reduce transportation and motion waste, improve communication, and support cross‑training.
A case study from a UK precision‑machining firm shows that converting a traditional functional layout into three dedicated cells reduced travel distance by 30 % and increased overall equipment effectiveness (OEE) by 12 %. Challenges include the upfront cost of rearranging equipment and the need to redesign job routing to suit the new cell structure.
Standard Work is the documented best practice for performing a task, specifying the sequence, timing, and methods to achieve consistent results. Standard work provides a baseline for training, improvement, and performance measurement. For example, a standard work sheet for assembling a gearbox may list each bolt torque, the order of component insertion, and the time allocated for each step.
The difficulty lies in maintaining the relevance of the standard work as processes evolve. Regular audits and a culture that encourages suggestions for improvement help keep standard work current and effective.
Gemba (Japanese for “the actual place”) refers to the shop floor or the location where value is created. A Gemba walk involves managers visiting the production area to observe operations, engage with employees, and identify opportunities for improvement. In the UK, Gemba walks are often scheduled weekly, with leaders using a checklist to focus on safety, quality, and flow.
Common pitfalls include turning the walk into a supervisory inspection rather than a learning exercise, and failing to act on observations. To avoid these, managers should adopt a respectful, curiosity‑driven approach and ensure follow‑up actions are recorded and implemented.
Andon is a visual signalling system that alerts operators and supervisors to a problem on the line, enabling immediate response. An Andon light may turn red when a defect is detected, prompting the operator to stop the line and call for assistance. The Andon system supports the principle of “stop‑the‑line” to prevent the passage of defective items downstream.
Implementing Andon requires clear escalation procedures and a culture that empowers workers to halt production without fear of reprisal. In some UK factories, Andon is integrated with digital dashboards that capture the time of stoppage, the nature of the problem, and the corrective action taken.
Poka‑Yoke (mistake‑proofing) is a design technique that prevents errors or makes them immediately detectable. Examples include a sensor that prevents a machine from starting unless a safety guard is in place, or a jig that only accepts correctly oriented components. Poka‑yoke devices are inexpensive yet highly effective at reducing defects.
Challenges include identifying the most critical error modes and designing solutions that do not impede productivity. In complex assembly operations, a systematic Failure Modes and Effects Analysis (FMEA) can guide the selection of appropriate poka‑yoke measures.
Heijunka (Level Scheduling) smooths production by distributing work evenly over time, reducing peaks and valleys in demand. Instead of producing large batches of a single product, a Heijunka box may schedule a mix of product variants each day to match a constant takt time. This approach stabilises workload, improves utilisation, and reduces inventory.
The main difficulty is achieving the necessary flexibility in the workforce and equipment to handle varied product mixes. Companies often invest in cross‑training and modular tooling to support level scheduling.
Overall Equipment Effectiveness (OEE) is a composite metric that measures the percentage of manufacturing time that is truly productive. OEE combines three factors: Availability (percentage of scheduled time the equipment is running), Performance (speed relative to the ideal cycle time), and Quality (percentage of good units produced). An OEE of 85 % is generally considered world‑class.
OEE provides a clear, data‑driven picture of equipment performance and highlights areas for improvement. However, it can be misinterpreted if the underlying data are inaccurate or if the metric is used in isolation without considering other factors such as labour productivity or supply‑chain reliability.
Total Productive Maintenance (TPM) is a proactive maintenance strategy that aims to maximise equipment effectiveness while involving operators in routine upkeep. TPM is structured around eight pillars, including autonomous maintenance, planned maintenance, and focused improvement. In a UK food‑processing plant, operators may be trained to perform daily cleaning, lubrication, and visual inspection, freeing the maintenance team to concentrate on predictive tasks.
Common obstacles include insufficient training, lack of time for operators to perform maintenance tasks, and inadequate measurement of TPM outcomes. Successful TPM programmes typically tie maintenance activities to OEE targets and recognise operator contributions through incentive schemes.
Theory of Constraints (TOC) focuses on identifying the most limiting factor (the constraint) that hinders the system’s ability to achieve higher throughput. Once the constraint is identified, the organisation works to exploit, subordinate, elevate, and finally re‑evaluate the constraint. In a UK printing operation, the bottleneck might be the finishing binder, which limits the overall output. By adding a second binder (elevating the constraint) and synchronising upstream processes (subordinating), the plant can increase overall throughput.
A challenge with TOC is that constraints can shift rapidly in dynamic environments, requiring continuous monitoring. Integrating TOC with lean tools such as value‑stream mapping helps maintain focus on the most critical improvement opportunities.
Hoshin Kanri (Policy Deployment) aligns organisational goals with daily activities through a structured planning process. Senior management defines strategic objectives (the “hoshin”), which are cascaded down to departments and work teams via measurable targets and action plans. Progress is reviewed regularly, ensuring that improvements contribute to long‑term strategic goals.
In practice, UK manufacturers often combine Hoshin Kanri with balanced scorecards to track financial, customer, internal process, and learning‑and‑growth metrics. The major difficulty lies in translating high‑level strategic intent into actionable tasks without losing focus or creating overly complex plans. Clear communication and periodic review cycles are essential to maintain alignment.
Lean Six Sigma merges the waste‑elimination focus of lean with the statistical rigor of Six Sigma. While lean addresses process flow and waste, Six Sigma targets variation and defects using DMAIC (Define, Measure, Analyse, Improve, Control). A UK aerospace component supplier may use Lean Six Sigma to streamline a machining process (lean) while reducing dimensional variance (Six Sigma) to meet tight tolerance specifications.
The primary challenge is cultural—lean emphasises rapid, visual improvements, whereas Six Sigma often involves longer, data‑driven projects. Successful integration requires balanced training programmes and leadership that values both speed and precision.
Visual Management employs visual cues such as signage, colour‑coding, shadow boards, and performance displays to make information instantly understandable. On a UK assembly line, a visual board may show real‑time OEE, target versus actual production, and safety incidents. Visual management supports rapid decision‑making, reduces reliance on verbal instructions, and helps identify deviations early.
Implementation challenges include ensuring that visual tools are kept up‑to‑date and avoiding visual clutter that can confuse rather than clarify. Regular audits and employee involvement in designing visual aids help maintain effectiveness.
Kaizen Blitz is an intensive, short‑duration improvement event focused on a specific problem area. Teams typically consist of frontline workers, supervisors, and engineers who work together for 2‑5 days to analyse the current state, generate ideas, implement changes, and document results. A Kaizen blitz at a UK metal‑fabrication shop might target the reduction of scrap generated during laser cutting, resulting in a 15 % decrease in material waste.
Key success factors include clear problem definition, strong facilitation, and immediate implementation of countermeasures. A common pitfall is insufficient follow‑up, which can cause the gains to erode over time. Post‑blitz reviews and integration of improvements into standard work mitigate this risk.
Continuous Improvement Culture extends beyond isolated projects, embedding the mindset of ongoing enhancement into everyday work. It encourages every employee to seek ways to improve their own processes, share ideas, and experiment safely. In the UK, many organisations foster this culture through suggestion schemes, regular improvement meetings, and recognition programmes.
Barriers to cultivating a continuous improvement culture include hierarchical structures that inhibit open communication, lack of training, and short‑term performance pressures. Leadership commitment, transparent reward systems, and empowerment of frontline staff are essential to overcome these barriers.
Kanban Board is a visual representation of work items moving through stages such as “To Do,” “In Progress,” and “Done.” In a lean production environment, a Kanban board can be physical (cards on a wall) or digital (software). It provides real‑time visibility of work status, limits work‑in‑process, and helps identify bottlenecks.
A typical challenge is setting appropriate WIP limits; too low a limit stalls progress, while too high a limit hides problems. Continuous monitoring and adjustment of limits, based on flow metrics, ensures the board remains an effective control tool.
Pull Planning is a scheduling technique that starts with the final delivery date and works backwards, determining the start dates for each preceding activity based on takt time and lead time. This method ensures that each step is ready just in time for the next, minimising idle time and inventory.
Applying pull planning in a UK construction project, for example, may involve coordinating material deliveries, subcontractor schedules, and inspections so that each phase begins precisely when needed. The main difficulty is aligning multiple external suppliers and contractors to the pull schedule, which often requires contractual incentives and collaborative planning.
Level Production (Levelled Loading) spreads demand evenly across the planning horizon, avoiding spikes that cause over‑production or under‑utilisation. By smoothing demand, level production reduces the need for large inventory buffers and enables smaller batch sizes. In a UK consumer‑goods manufacturer, level production may involve producing a mix of product variants each day rather than single‑variant runs.
The challenge is dealing with seasonality and promotional spikes. Companies often use flexible capacity (e.G., Overtime or temporary labour) and demand‑shaping techniques (e.G., Price incentives) to accommodate short‑term fluctuations while preserving overall level production.
Demand Forecasting predicts future customer demand using historical data, market trends, and statistical models. Accurate forecasts are critical for lean planning, as they inform takt time, inventory levels, and capacity planning. In the UK, many firms use software such as SAP Integrated Business Planning (IBP) or demand‑forecasting modules within ERP systems.
Forecast errors can lead to over‑production or stockouts, undermining lean objectives. To mitigate this, organisations combine statistical forecasting with collaborative planning, involving sales, marketing, and supply‑chain partners to refine predictions.
Batch Size is the quantity of units processed together before moving to the next operation. Large batch sizes increase inventory and lead time, while small batch sizes support flow and responsiveness. Lean principles advocate reducing batch size to the smallest economically feasible quantity, often referred to as “one‑piece flow.”
Determining the optimal batch size involves balancing setup costs, equipment capacity, and demand variability. In practice, many UK manufacturers use a “batch‑size calculator” that incorporates changeover time, production rate, and takt time to recommend a feasible batch size.
Changeover is the transition from producing one product or variant to another. Reducing changeover time enables smaller batches and more flexible production. Techniques such as SMED, parallel processing of setup tasks, and quick‑release tooling are commonly employed.
A practical example is a UK sheet‑metal fab that installs quick‑change dies, allowing a switch from producing brackets to panels in under five minutes, compared with the previous thirty‑minute changeover. This reduction improves line utilisation and reduces inventory of each product type.
Flow Efficiency measures the proportion of time that a product spends adding value versus waiting. It is calculated by dividing value‑adding time by total lead time. Low flow efficiency indicates high levels of waste. For instance, if a product requires 2 hours of processing but the total lead time is 12 hours, flow efficiency is 17 %, signalling significant opportunities for improvement.
Improving flow efficiency often requires synchronising processes, reducing batch sizes, and eliminating bottlenecks. However, organisations must balance efficiency gains with the need for flexibility, especially when demand is uncertain.
Visual Controls are tools that provide immediate, at‑a‑glance information about the status of a process. Examples include colour‑coded floor markings that indicate safe walkways, shadow boards that show the correct placement of tools, and electronic displays that show real‑time production metrics. Visual controls support standard work, reduce motion waste, and help operators quickly identify abnormalities.
The main challenge is ensuring that visual controls are intuitive and maintained. Over‑complicated visuals can lead to confusion, while outdated displays can mislead operators. Regular reviews and employee involvement in design improve effectiveness.
Standard Work Combination Table (SWCT) documents the sequence of operations, the time each operation takes, and the number of operators required. It helps planners balance workloads, identify idle time, and design efficient line layouts. In a UK medical‑device assembly line, an SWCT may show that three operators are needed for a 30‑second operation, while a downstream operation only requires one operator for 45 seconds, indicating a potential imbalance.
Using the SWCT, planners can reassign tasks, add parallel workstations, or adjust takt time to achieve a smoother flow. The difficulty lies in maintaining accurate data as processes evolve; frequent updates and cross‑functional collaboration are essential.
Process Mapping is a broader term that includes value‑stream mapping but also captures detailed process steps, decision points, and information flow. It serves as a baseline for improvement projects, enabling teams to visualise current performance and identify waste. In the UK, many organisations use software such as Microsoft Visio or Lucidchart to create process maps.
Common pitfalls include creating overly complex maps that are hard to interpret, and failing to involve the people who actually perform the work. Engaging operators in the mapping exercise ensures accuracy and fosters ownership of subsequent improvements.
Work‑In‑Process (WIP) Limits are caps on the amount of inventory allowed at each stage of production. By limiting WIP, organisations prevent over‑production, reduce lead time, and expose bottlenecks. Kanban cards often serve as the mechanism for enforcing WIP limits; each card represents a permitted unit of inventory.
Setting appropriate WIP limits requires understanding the capacity of each workstation, the variability of demand, and the desired level of responsiveness. Too stringent a limit can cause frequent stoppages, while too lax a limit masks inefficiencies. Continuous monitoring and adjustment based on flow metrics are necessary.
Gantt Chart is a traditional project‑management tool that displays tasks over time. While not inherently lean, Gantt charts can be adapted to support lean planning by incorporating takt time, WIP limits, and pull‑based scheduling. However, excessive reliance on fixed schedules can reintroduce push‑type dynamics.
In the UK, many production planners combine Gantt charts with lean tools, using the chart for high‑level coordination while maintaining flexibility at the shop‑floor level through kanban signals.
Pull‑Based Scheduling aligns production orders with actual consumption, using signals such as kanban cards or electronic triggers. Unlike push scheduling, which forecasts demand and creates a master production schedule, pull‑based scheduling reacts to real‑time demand, reducing inventory and improving responsiveness.
A practical example is a UK beverage bottling plant that uses RFID‑enabled pallets; when a pallet reaches a predetermined point in the distribution network, the system automatically generates a pull signal for the next batch, ensuring continuous replenishment without over‑stocking.
Implementing pull‑based scheduling requires reliable data capture, robust communication systems, and a culture that trusts real‑time signals over forecasted plans. Resistance often emerges from senior managers accustomed to traditional planning methods; change management and pilot projects help demonstrate the benefits.
Supplier Integration involves close collaboration with upstream partners to align their processes with lean objectives. Techniques include sharing demand forecasts, synchronising production schedules, and implementing vendor‑managed inventory (VMI). In the UK automotive supply chain, Tier‑1 suppliers often adopt lean practices to meet the just‑in‑time requirements of OEMs.
Challenges include differing organisational cultures, varying levels of maturity, and logistical constraints such as transportation lead times. Formal agreements, joint Kaizen events, and shared performance metrics can facilitate smoother integration.
Customer Value Proposition defines the unique benefits that a product offers to the customer, influencing the definition of value in lean terms. Understanding the value proposition helps planners prioritise features that truly matter, avoiding over‑processing. For example, a UK renewable‑energy equipment manufacturer may discover that customers value reliability over aesthetic finish, directing resources toward robust testing rather than cosmetic polishing.
Misalignment between engineering design and customer value can lead to unnecessary cost and waste. Regular engagement with customers, market research, and feedback loops ensure that the value proposition remains accurate and relevant.
Lean Metrics are quantitative indicators used to monitor performance and guide improvement. Core lean metrics include:
- Lead Time - Cycle Time - Throughput - OEE - First‑Pass Yield (FPY) - Inventory Turns
These metrics provide a balanced view of speed, quality, and efficiency. In the UK, many organisations embed lean metrics into their balanced scorecards, linking them to financial incentives.
A common challenge is metric overload; focusing on too many indicators can dilute attention. Selecting a concise set of key performance indicators (KPIs) that align with strategic goals helps maintain focus.
First‑Pass Yield (FPY) measures the proportion of units that meet quality standards without any rework. High FPY indicates effective process control and low defect rates. For a UK pharmaceutical packaging line, an FPY of 98 % may be considered excellent, whereas a lower rate signals the need for process adjustments or poka‑yoke implementation.
Improving FPY often requires root‑cause analysis, operator training, and equipment calibration. However, a narrow focus on FPY without considering overall throughput can lead to sub‑optimal decisions; balancing quality with flow is essential.
Inventory Turns indicate how many times inventory is sold or used over a period, reflecting inventory efficiency. Higher inventory turns suggest leaner inventory management. A UK electronics component distributor may aim for 8‑10 turns per year, compared with industry averages of 4‑5.
Achieving higher turns may require tighter demand forecasting, improved supplier lead times, and robust kanban systems. The trade‑off is the risk of stockouts, which must be carefully managed.
Continuous Flow Metrics such as “takt compliance” assess how closely actual production matches the planned takt time. Monitoring takt compliance helps identify deviations early, allowing corrective actions before significant waste accumulates.
In practice, real‑time dashboards display takt compliance percentages for each workstation, alerting supervisors when compliance falls below a threshold (e.G., 95 %). Implementing corrective actions promptly sustains flow and prevents bottlenecks.
Lean Leadership refers to the behaviours and competencies required of managers to drive lean transformation. Key attributes include:
- Coaching and mentoring staff - Encouraging problem‑solving at the lowest level - Demonstrating respect for people - Making decisions based on data
Lean leaders in the UK often undergo specific training programmes, such as the Lean Leadership Certificate offered by professional bodies. The challenge is translating leadership concepts into daily actions; regular coaching sessions, shadowing, and performance reviews reinforce lean leadership behaviours.
Cross‑Training equips employees with the skills to perform multiple tasks, enhancing flexibility and reducing reliance on specialised labour. In a UK metal‑fabrication shop, cross‑trained operators can switch between welding, grinding, and inspection duties, smoothing workload fluctuations.
The primary obstacle is the initial investment in training and the potential temporary reduction in productivity as employees learn new tasks. Structured training plans, mentorship, and clear competency matrices help accelerate skill acquisition while maintaining quality.
Visual Factory extends visual management to the entire production environment, creating an “at‑a‑glance” system that communicates status, standards, and performance. Elements include floor markings, status boards, colour‑coded shadows, and real‑time dashboards.
A visual factory enables quick identification of abnormal conditions, such as a sudden increase in defect rate displayed on a large screen. It also supports safety by highlighting hazards and safe routes. Implementation challenges involve ensuring consistency across shifts and maintaining visual tools as processes evolve.
Lean Audits assess the degree to which lean principles are applied across the organisation. Audits typically review waste elimination, standard work adherence, visual management, and performance metrics. In the UK, many firms conduct quarterly lean audits, assigning scores to each area and developing action plans for gaps.
Common issues include audit fatigue, where employees view audits as punitive rather than improvement‑focused. To mitigate this, auditors should adopt a collaborative approach, emphasising learning and providing clear guidance for corrective actions.
Lean Transformation Roadmap outlines the staged implementation of lean across an organisation, typically progressing from initial awareness to full integration. Phases may include:
1. Awareness and training 2. Pilot projects (e.G., Kaizen events) 3. Standardisation of tools (5S, VSM) 4. Integration with supply chain 5. Continuous improvement culture
The roadmap provides a structured path, but organisations must remain adaptable. External factors such as Brexit‑related supply‑chain disruptions or changes in regulatory standards can require adjustments to the plan. Regular review of the roadmap ensures alignment with current business realities.
Gantt‑Style Pull Planning combines the visual timeline of a Gantt chart with pull‑based principles, displaying tasks as they are triggered by downstream demand. In a UK construction project, the pull‑planning tool may show that concrete pouring is scheduled only after the preceding structural steel erection is confirmed complete, reducing idle time and material waste.
Challenges include synchronising multiple contractors and ensuring that the pull signals are reliable. Digital collaboration platforms that integrate scheduling, communication, and real‑time status updates help overcome these hurdles.
Levelled Production (Heijunka) Board visualises the mix of products scheduled for each time period, supporting the smoothing of demand. In a UK consumer‑electronics assembly line, the Heijunka board may display a weekly plan of 40 % smartphones, 30 % tablets, and 30 % wearables, balanced to match takt time. Adjustments are made weekly based on actual sales data.
The difficulty is maintaining flexibility while adhering to the level schedule, particularly when a sudden surge in demand for one product occurs. Companies often retain a small buffer of capacity that can be deployed to meet short‑term spikes without disrupting the overall level plan.
Standard Work Instructions (SWI) provide detailed, step‑by‑step guidance for each task, including safety precautions, required tools, and expected times. SWIs support training, quality consistency, and performance measurement. In a UK aerospace component shop, SWIs may be displayed on tablets at each workstation, allowing operators to reference procedures quickly.
Maintaining the relevance of SWIs is an ongoing challenge; as processes improve, documents must be updated promptly to avoid confusion. Linking SWIs to the change‑management system ensures that revisions are tracked and communicated.
Gemba Walk Checklist is a structured list used by managers during shop‑floor visits to focus on key areas such as safety, quality, flow, and waste. The checklist may include items like “Are workstations organised according to 5S?” Or “Is any abnormal noise observed on the machine?” Using a checklist ensures consistency and prevents important observations from being missed.
The risk is that the checklist becomes a bureaucratic exercise rather than a genuine engagement. To avoid this, managers should use the checklist as a guide but remain flexible, asking open‑ended questions and listening to operator insights.
5 Whys Analysis is a simple root‑cause technique that repeatedly asks “Why?” Until the underlying cause of a problem is uncovered. For instance, a defect in a UK automotive brake component may be traced through successive whys to a mis‑aligned fixture, then to insufficient fixture maintenance, and finally to a lack of standard work for fixture calibration.
While powerful, the 5 Whys can lead to superficial answers if not applied rigorously. Combining the technique with other tools such as fishbone diagrams or FMEA strengthens the analysis.
Key takeaways
- The following explanation covers the most frequently encountered terms, providing definitions, practical examples, typical applications, and common challenges faced by practitioners in the United Kingdom.
- For example, assembling a gearbox adds value because the customer receives a functional component, whereas moving the partially assembled gearbox between distant workstations may not add value if it does not improve quality or speed.
- Lean identifies seven classic types of waste, often expanded to eight or nine in modern practice.
- A UK automotive parts supplier might transport stamped metal sheets across a large floor before cutting them, adding handling time without improving the product.
- Holding large stocks of steel rods to guard against supply disruptions can mask underlying scheduling problems and increase holding costs.
- An operator who must walk to three different tool stations to complete a sub‑assembly spends valuable time on motion rather than on the assembly itself.
- Waiting – Delays caused by waiting for materials, information, or equipment.