
Advanced Chart Pattern Recognition
Expert-defined terms from the Advanced Technical Analysis course at HealthCareCourses (An LSIB brand). Free to read, free to share, paired with a professional course.
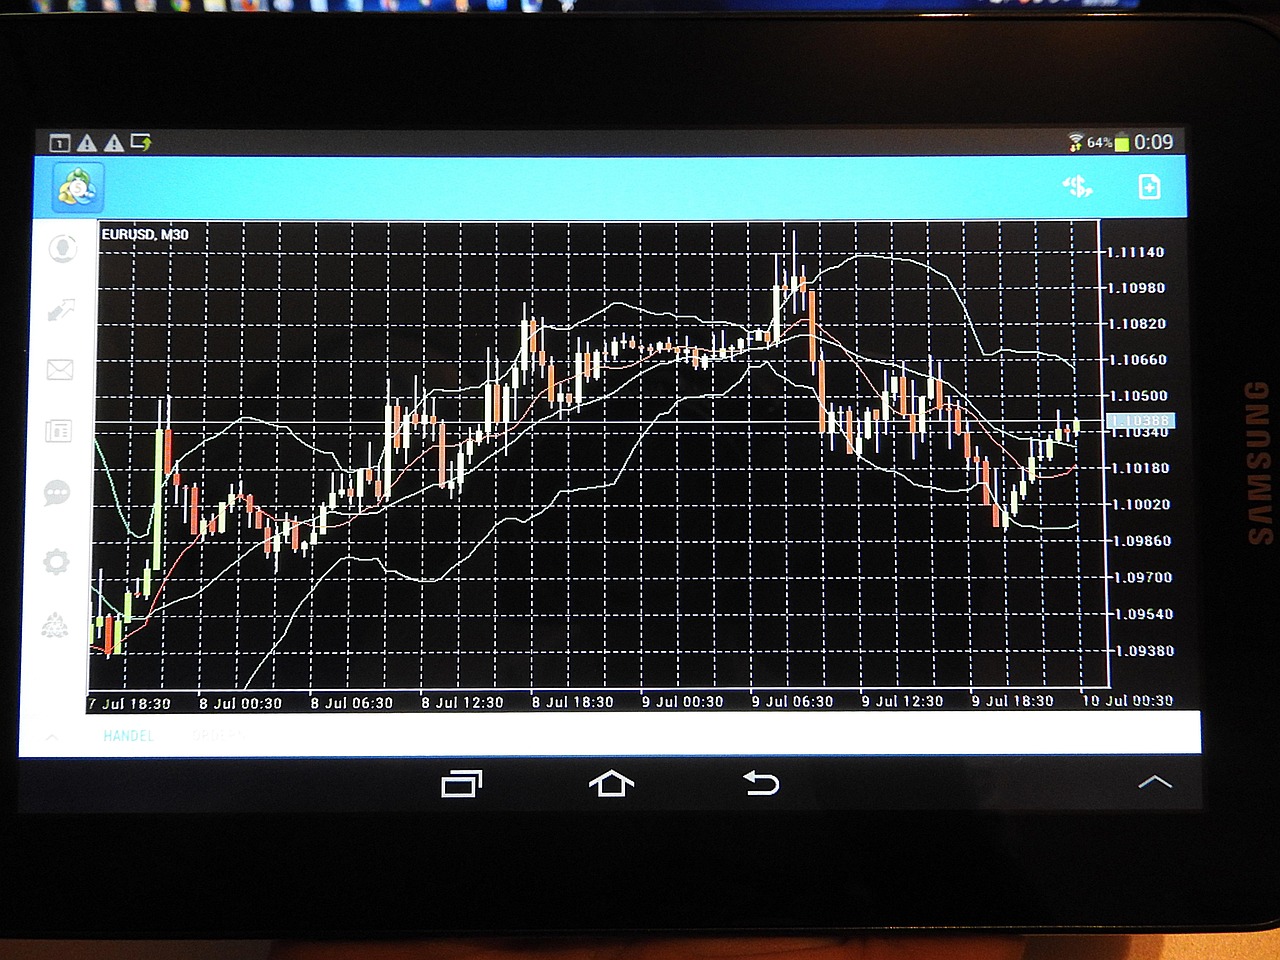
Ascending Triangle #
Ascending Triangle
Explanation #
A bullish continuation pattern formed by a flat upper resistance line and a rising lower support line, indicating increasing buying pressure.
Example #
In a daily chart of XYZ, the price repeatedly touched $50 resistance while lows climbed from $45 to $48, then broke above $50 on high volume.
Practical application #
Traders often enter long positions near the breakout point, placing stop‑loss just below the last low of the triangle.
Challenges #
False breakouts can occur; confirming volume surge and retest of the breakout level helps mitigate risk.
Ascending Flag #
Ascending Flag
Explanation #
A short‑term rectangular consolidation that slopes upward, typically following a sharp price advance, suggesting a pause before the trend resumes.
Example #
After a 10% rally in ABC, the price moved between $30 and $35 for several days, forming an ascending flag before moving higher.
Practical application #
Position traders may place entry orders just above the flag’s upper boundary, targeting a move equal to the prior impulse’s height.
Challenges #
The pattern can be mistaken for a simple pullback; confirming the flag’s shape and volume decline is essential.
Bearish Engulfing #
Bearish Engulfing
Explanation #
A two‑candle pattern where a small bullish candle is completely engulfed by a larger bearish candle, indicating potential downside momentum.
Example #
On a 4‑hour chart of DEF, a green candle closed at $20, then a red candle opened at $20.5 and closed at $18, fully engulfing the prior candle.
Practical application #
Traders may short the asset after the pattern, setting stop‑loss above the engulfing candle’s high.
Challenges #
In strong uptrends, the pattern may produce only a brief pause; combining it with other indicators improves reliability.
Broadening Formation #
Broadening Formation
Explanation #
A pattern characterized by diverging trendlines that create a widening shape, reflecting increasing volatility and indecision.
Example #
GHI’s weekly chart shows higher highs and lower lows expanding outward over several months, forming a megaphone.
Practical application #
Some analysts anticipate a breakout in the direction of the prevailing trend after the formation completes.
Challenges #
The pattern is notoriously unreliable; breakout direction is difficult to predict, requiring careful risk management.
Butterfly Pattern #
Butterfly Pattern
Explanation #
A harmonic pattern consisting of four legs (X‑A‑B‑C‑D) where point D is projected at 78.6% of the XA leg, creating a “W” shape.
Example #
In the daily chart of JKL, the XA leg measured 100 pips; the D point was plotted at 78.6 pips from X, forming a valid butterfly.
Practical application #
Traders may place limit orders near the D point, expecting a reversal toward the X‑A leg.
Challenges #
Precise measurement is critical; slight deviations can invalidate the pattern, leading to false signals.
Capitulation #
Capitulation
Explanation #
A rapid, widespread sell‑off often accompanied by a surge in volume, marking the end of a downtrend.
Example #
During the 2020 market crash, the S&P 500 fell 10% in a single day with volume exceeding three times the average, indicating capitulation.
Practical application #
Some investors view capitulation as a buying opportunity, entering long positions after the sell‑off stabilizes.
Challenges #
Distinguishing capitulation from a continuation of the decline requires analysis of broader market context.
Channel Up #
Channel Up
Explanation #
A price channel where both upper and lower boundaries slope upward, indicating a sustained bullish trend.
Example #
On a 30‑minute chart of MNO, the price moved between $15 (lower) and $18 (upper) while both lines tilted upward.
Practical application #
Traders may buy near the lower boundary and set profit targets near the upper boundary, adjusting stops as the channel progresses.
Challenges #
Breakouts below the lower trendline may signal trend reversal; monitoring for such breaches is essential.
Consolidation Zone #
Consolidation Zone
Explanation #
A period where price oscillates within a narrow range, lacking a clear directional bias.
Example #
PQR’s intraday chart traded between $45 and $48 for several hours, forming a consolidation zone before the next move.
Practical application #
Breakout traders watch for price exiting the zone on increased volume to capture the ensuing directional move.
Challenges #
Consolidation can persist longer than expected; premature entries may result in whipsaw losses.
Cup and Handle #
Cup and Handle
Explanation #
A bullish pattern that resembles a cup (rounded bottom) followed by a short consolidation (handle), indicating a potential breakout.
Example #
STU’s weekly chart formed a cup from $30 to $40, then a handle from $38 to $39 before breaking above $40.
Practical application #
Long positions are often placed above the handle’s high, targeting a move equal to the cup’s depth.
Challenges #
The handle may fail to form; misidentifying a cup can lead to poor trade entries.
Double Bottom #
Double Bottom
Explanation #
A bullish reversal pattern featuring two lows at similar price levels separated by a moderate high, resembling a “W”.
Example #
VWX’s daily chart showed lows near $20 on Jan 5 and Jan 20, with a peak at $25 between them, forming a double bottom.
Practical application #
Traders may buy near the breakout above the intervening high, setting stop‑loss below the low points.
Challenges #
The second low must be sufficiently higher than the first to confirm pattern strength; otherwise, the pattern may be invalid.
Double Top #
Double Top
Explanation #
A bearish reversal pattern where price reaches a high twice, with a moderate trough in between, forming an “M”.
Example #
YZA’s 4‑hour chart peaked at $150 on two occasions, with a dip to $140 between peaks, creating a double top.
Practical application #
Short positions are often entered after a break below the trough, with stop‑loss above the tops.
Challenges #
In strong uptrends, the pattern may fail, requiring confirmation from volume or momentum indicators.
Elliott Wave Principle #
Elliott Wave Principle
Explanation #
A theory proposing that market prices move in repetitive wave patterns, typically five upward “impulse” waves followed by three corrective waves.
Example #
A trader identifies waves 1‑5 in the EUR/USD daily chart, then anticipates a corrective “ABC” pattern.
Practical application #
Wave analysis helps forecast future price direction and potential reversal points.
Challenges #
Wave counting is subjective; misidentifying wave degrees can lead to erroneous forecasts.
Fibonacci Extension #
Fibonacci Extension
Explanation #
Levels derived from Fibonacci ratios (e.g., 127.2%, 161.8%) used to estimate potential price targets beyond the original move.
Example #
After a 100‑point rally, the 161.8% extension projects a target 161 points above the start of the move.
Practical application #
Traders set profit targets at extension levels, aligning them with trend direction.
Challenges #
Extensions may be invalid if the market lacks momentum; combining with other signals improves accuracy.
Fibonacci Retracement #
Fibonacci Retracement
Explanation #
Horizontal lines indicating potential support or resistance at key Fibonacci levels (23.6%, 38.2%, 50%, 61.8%, 78.6%) after a price move.
Example #
In a downtrend, the price retraced to the 61.8% level before resuming the decline.
Practical application #
Traders often enter positions near retracement levels, expecting the trend to continue.
Challenges #
Multiple retracement levels can cause indecision; confirming with volume or oscillators is advisable.
Flag Pattern #
Flag Pattern
Explanation #
A short‑term rectangular consolidation that slopes against the prevailing trend, indicating a brief pause before continuation.
Example #
After a 5% rise in LMN, the price moved sideways between $70 and $73 for a week, forming a flag.
Practical application #
Entry orders are placed just beyond the flag’s boundary in the direction of the prior impulse.
Challenges #
Flags can be misread as simple pullbacks; ensuring the prior move was a strong impulse reduces false signals.
Fisher Transform #
Fisher Transform
Explanation #
A technical indicator that converts price data into a Gaussian‑like distribution, enhancing extreme values for easier identification of turning points.
Example #
On a 1‑hour chart, the Fisher Transform crossed above its signal line, suggesting a bullish reversal.
Practical application #
Traders use crossovers of the Fisher line and its signal line to time entries and exits.
Challenges #
The indicator can generate frequent whipsaws in choppy markets; filtering with trend filters can improve reliability.
Gap Up #
Gap Up
Explanation #
An opening price higher than the previous day’s close, leaving an empty space on the chart, often reflecting news or strong demand.
Example #
After earnings beat, the stock opened $2 above the prior close, creating a gap up.
Practical application #
Gap up can be used as a momentum signal; traders may buy on the open expecting continuation.
Challenges #
Gaps can be filled quickly; assessing the gap’s cause and volume is crucial.
Gap Down #
Gap Down
Explanation #
An opening price lower than the previous day’s close, leaving a void on the chart, indicating negative sentiment or adverse news.
Example #
A commodity fell 5% after a supply shock, opening below the prior close and forming a gap down.
Practical application #
Gap down may signal further downside; short positions can be initiated if the gap holds.
Challenges #
Gaps often get filled; monitoring for reversal patterns near the gap helps avoid premature entries.
Harmonic Patterns #
Harmonic Patterns
Explanation #
A family of chart patterns (e.g., Gartley, Bat, Butterfly) that rely on precise Fibonacci relationships to define potential reversal zones.
Example #
A Gartley pattern forms when the AB leg retraces 61.8% of XA and CD projects 78.6% of AB.
Practical application #
Traders place orders at the pattern’s D point, anticipating a reversal.
Challenges #
Accurate measurement is demanding; minor miscalculations can invalidate the pattern.
Head and Shoulders #
Head and Shoulders
Explanation #
A bearish reversal pattern consisting of a left shoulder, a higher head, and a right shoulder, with a neckline connecting the lows.
Example #
On a daily chart, the price formed peaks at $50 (left shoulder), $60 (head), and $52 (right shoulder), with a neckline at $45.
Practical application #
Short positions are entered after price breaks below the neckline, targeting the head‑to‑neckline distance.
Challenges #
Pattern symmetry and volume confirmation are key; asymmetric formations may produce weaker signals.
Inverse Head and Shoulders #
Inverse Head and Shoulders
Explanation #
A mirror image of the classic head and shoulders, indicating a potential upward reversal after a downtrend.
Example #
A commodity’s chart showed a low at $30, deeper low at $25 (head), and a higher low at $28 (right shoulder), with a neckline at $32.
Practical application #
Long entries are taken when price breaks above the neckline, aiming for a move equal to the head‑to‑neckline height.
Challenges #
False breakouts are common; confirming with volume and momentum indicators reduces risk.
Heikin‑Ashi #
Heikin‑Ashi
Explanation #
A modified candlestick chart that averages price data to produce smoother visual trends, reducing noise.
Example #
In a Heikin‑Ashi chart of QRS, the candles turned from red to green, indicating a shift to bullish momentum.
Practical application #
Traders use Heikin‑Ashi to stay in trends longer, exiting when color changes.
Challenges #
The smoothing effect can lag actual price, leading to delayed entries or exits.
Ichimoku Cloud #
Ichimoku Cloud
Explanation #
A comprehensive indicator comprising five lines that define support, resistance, trend direction, and momentum.
Example #
When price moves above the cloud and the Tenkan‑sen crosses above the Kijun‑sen, a bullish signal is generated.
Practical application #
Traders may enter long positions when price is above the cloud and the bullish “kumo breakout” occurs.
Challenges #
The cloud can be wide, producing ambiguous signals in ranging markets; using additional filters helps.
Inside Bar #
Inside Bar
Explanation #
A price bar whose high and low are entirely within the range of the preceding bar, indicating market indecision.
Example #
On a 15‑minute chart, a small red candle formed inside the previous green candle’s range.
Practical application #
Traders often place pending orders above the high (for bullish) or below the low (for bearish) anticipating a breakout.
Challenges #
Inside bars may result in false breakouts; confirming with volume or trend context improves reliability.
Ichimoku Kinko Hyo #
Ichimoku Kinko Hyo
Explanation #
The full Japanese term for the Ichimoku system, translating to “one glance equilibrium chart,” emphasizing its ability to provide a quick market snapshot.
Practical application #
Same as Ichimoku Cloud; the name underscores comprehensive analysis.
Challenges #
Same as Ichimoku Cloud.
J Pattern #
J Pattern
Explanation #
A rare pattern resembling the letter “J,” where price sharply drops then reverses sharply upward, often after a prolonged decline.
Example #
A stock’s weekly chart showed a steep decline to $10, then a rapid rally to $15, forming a J shape.
Practical application #
May signal a short‑term reversal; traders could consider long positions after the upward swing.
Challenges #
The pattern’s rarity makes it difficult to identify reliably; corroborating with volume and momentum is advisable.
Keltner Channel #
Keltner Channel
Explanation #
A volatility‑based envelope consisting of an exponential moving average (EMA) central line and bands set a multiple of the Average True Range (ATR) above and below.
Example #
On a 30‑minute chart, price touched the upper Keltner band during a rally, then retreated to the middle EMA.
Practical application #
Breakouts above the upper band may signal bullish continuation; reversals at the bands can indicate overextension.
Challenges #
In low‑volatility environments, bands narrow, producing frequent false signals; adjusting ATR multiplier helps.
Ladder Pattern #
Ladder Pattern
Explanation #
A series of incremental price moves in the same direction, forming a stair‑like appearance, often reflecting steady accumulation or distribution.
Example #
Over a month, a commodity’s price rose in 5‑point steps, each higher than the previous, creating a ladder.
Practical application #
Traders may follow the ladder, adding to positions on each step while trailing stops.
Challenges #
Ladders can reverse abruptly; monitoring for loss of momentum is essential.
Long Legged Doji #
Long Legged Doji
Explanation #
A candlestick with long upper and lower shadows and a small real body, indicating high indecision.
Example #
On a daily chart, a Doji formed with a 3‑point high, a 3‑point low, and a 0.2‑point body.
Practical application #
Often used as a signal of potential reversal when appearing after a strong trend.
Challenges #
Dojis alone are weak; confirming with trend or momentum indicators is recommended.
Marubozu #
Marubozu
Explanation #
A candle with little to no shadows; a bullish marubozu opens at its low and closes at its high, indicating strong buying pressure.
Example #
A 5‑minute chart shows a green marubozu from $100 to $105 with no wicks.
Practical application #
Signals continuation of the prevailing trend; traders may add to existing positions.
Challenges #
In choppy markets, marubozus may appear frequently, reducing their predictive value.
Moving Average Crossover #
Moving Average Crossover
Explanation #
A signal generated when a short‑term moving average crosses above (bullish) or below (bearish) a longer‑term moving average.
Example #
The 50‑day EMA crossed above the 200‑day EMA, creating a “golden cross.”
Practical application #
Many systematic strategies use crossovers to initiate long or short positions.
Challenges #
Crossovers lag price; false signals are common during sideways markets; combining with momentum filters helps.
Multiple Timeframe Analysis #
Multiple Timeframe Analysis
Explanation #
The practice of evaluating the same asset across several timeframes to gain a comprehensive view of trend, momentum, and potential entry points.
Example #
A trader observes a bullish trend on the weekly chart, a consolidation on the daily chart, and a breakout on the 4‑hour chart.
Practical application #
Aligning entries with higher‑timeframe trends improves trade probability.
Challenges #
Conflicting signals across timeframes can cause analysis paralysis; establishing hierarchy rules mitigates confusion.
Neckline #
Neckline
Explanation #
The horizontal or sloping line connecting the lows of a head‑and‑shoulders pattern, serving as a key breakout level.
Example #
In a classic head and shoulders, the neckline was drawn at $45, where price later broke downward.
Practical application #
Break of the neckline triggers entry and stop‑loss placement.
Challenges #
Determining exact neckline placement can be subjective; slight variations affect breakout timing.
On‑Balance Volume (OBV) #
On‑Balance Volume (OBV)
Explanation #
A cumulative volume measure that adds volume on up days and subtracts volume on down days, indicating buying or selling pressure.
Example #
OBV rose from 1 M to 1.5 M while price lagged, suggesting hidden accumulation.
Practical application #
Divergence between OBV and price can hint at upcoming reversals.
Challenges #
OBV does not account for price magnitude; combining with price‑based indicators yields stronger signals.
Pattern Recognition Software #
Pattern Recognition Software
Explanation #
Software tools that scan market data to automatically identify chart patterns based on predefined criteria.
Example #
A platform using AI detected 150 bullish engulfing patterns across the S&P 500 in a single day.
Practical application #
Traders can receive alerts for high‑probability patterns, reducing manual scanning time.
Challenges #
Over‑reliance on software may miss nuanced patterns; parameter tuning and regular validation are essential.
Pin Bar #
Pin Bar
Explanation #
A single candle with a small body and a long tail (wick) that protrudes beyond the recent range, indicating a potential reversal.
Example #
On a 1‑hour chart, a red pin bar opened at $75, dipped to $70, and closed near $74, suggesting bullish pressure.
Practical application #
Traders often enter in the direction of the tail after confirmation, placing stops near the tail’s extreme.
Challenges #
Pin bars can appear in trending markets without causing reversals; confirming with trend context is advisable.
Pivot Point #
Pivot Point
Explanation #
A price level calculated from the previous period’s high, low, and close, used to forecast intraday support and resistance.
Example #
Yesterday’s high 120, low 110, close 115 yield a pivot at 115, with resistance at 117.5 and support at 112.5.
Practical application #
Traders place orders near pivot levels, expecting price to react.
Challenges #
Pivot reliability varies across asset classes; combining with other indicators improves robustness.
Price Action #
Price Action
Explanation #
The study of raw price movements without reliance on lagging indicators, focusing on patterns, support, resistance, and momentum.
Example #
Observing a series of higher highs and higher lows indicates an uptrend.
Practical application #
Many traders develop discretionary strategies based solely on price action.
Challenges #
Requires extensive experience; subjective interpretation can lead to inconsistent results.
Quadruple Top #
Quadruple Top
Explanation #
A bearish reversal pattern featuring four similar highs separated by troughs, suggesting exhausted buying pressure.
Example #
A stock’s chart displayed four peaks near $80 over two weeks before declining.
Practical application #
Short positions may be entered after the price breaks below the lowest trough.
Challenges #
The pattern is rare; confirmation via volume and momentum is advisable.
Range Breakout #
Range Breakout
Explanation #
The event when price moves beyond established support or resistance levels, indicating a potential new trend.
Example #
After trading between $45 and $50, price closed at $52, breaking the upper range.
Practical application #
Traders set entry orders just beyond the range, targeting the ensuing move.
Challenges #
Breakouts can be false; using volume spikes and time‑of‑day filters reduces risk.
Rising Wedge #
Rising Wedge
Explanation #
A bearish pattern formed by converging trendlines that slope upward, indicating decreasing upward momentum.
Example #
On a 4‑hour chart, the price formed higher highs and higher lows that converged, creating a rising wedge.
Practical application #
Short positions are often taken after a break below the lower trendline.
Challenges #
In strong uptrends, the wedge may fail; confirming with volume decline helps.
Rolling Window Analysis #
Rolling Window Analysis
Explanation #
A technique that applies statistical calculations over a fixed-size moving window of data points to assess changing dynamics.
Example #
Calculating a 20‑day rolling standard deviation to gauge volatility shifts.
Practical application #
Helps adapt stop‑loss levels to recent volatility.
Challenges #
Choice of window length affects responsiveness; too short may cause noise, too long may lag.
Running Trend #
Running Trend
Explanation #
The prevailing direction of price over a defined period, often identified by a series of higher highs and higher lows (uptrend) or lower lows and lower highs (downtrend).
Example #
A three‑month chart shows sequential higher highs, indicating a running uptrend.
Practical application #
Trend‑following strategies align trades with the running trend.
Challenges #
Trends can reverse abruptly; trailing stops and periodic reassessment are needed.
Schiff Trend Cycle #
Schiff Trend Cycle
Explanation #
An indicator that combines a moving average with a cyclical component to identify trend strength and potential turning points.
Example #
The Schiff Trend Cycle turned negative after a prolonged uptrend, signaling possible weakness.
Practical application #
Traders may reduce exposure when the indicator turns down.
Challenges #
Performance varies across markets; tuning parameters is required for optimal results.
Screening Filters #
Screening Filters
Explanation #
A set of conditions applied to a universe of assets to narrow down candidates that meet specific technical or fundamental characteristics.
Example #
Filtering for stocks with a 20‑day SMA above the 50‑day SMA and RSI below 30.
Practical application #
Enables systematic identification of potential trade setups.
Challenges #
Over‑filtering can produce too few candidates; under‑filtering may generate noise.
Secondary Trend #
Secondary Trend
Explanation #
A short‑term price movement that runs opposite to the primary trend, often representing a correction or consolidation.
Example #
In a long‑term uptrend, a three‑day pullback forms a secondary downtrend.
Practical application #
Traders may use secondary trends for entry timing, buying on dips.
Challenges #
Misreading a secondary trend as a reversal can lead to premature exits.
Signal Line #
Signal Line
Explanation #
A moving average of an indicator (e.g., MACD, Fisher Transform) used to generate buy or sell signals when the primary line crosses it.
Example #
The MACD line crossed above its signal line, generating a bullish signal.
Practical application #
Crossovers are often used as entry triggers.
Challenges #
Signal lines introduce lag; in fast markets, crossovers may be delayed.
Sideways Market #
Sideways Market
Explanation #
A market condition where price oscillates within a narrow band without a clear directional bias.
Example #
Over a month, a currency pair traded between 1.1200 and 1.1300.
Practical application #
Strategies may focus on range trading, buying at support and selling at resistance.
Challenges #
Breakouts can occur unexpectedly; risk management is essential.
Simple Moving Average (SMA) #
Simple Moving Average (SMA)
Explanation #
An arithmetic mean of price over a specified number of periods, providing a smoothed representation of price action.
Example #
A 20‑day SMA of a stock smooths out daily fluctuations.
Practical application #
SMA crossovers with other SMAs can signal trend changes.
Challenges #
SMA lags price and can generate false signals in volatile markets.
Symmetrical Triangle #
Symmetrical Triangle
Explanation #
A pattern where both upper and lower trendlines converge toward a point, indicating decreasing volatility.
Example #
A stock’s price formed a symmetrical triangle over two weeks, with highs descending and lows ascending.
Practical application #
Traders anticipate a breakout in the direction of the prior trend, setting entry orders above or below the apex.
Challenges #
Breakout direction is uncertain; confirming with volume helps.
Technical Indicator #
Technical Indicator
Explanation #
A mathematical calculation based on price, volume, or open‑interest data, used to assess market conditions.
Example #
The Relative Strength Index (RSI) is a momentum oscillator.
Practical application #
Indicators aid in confirming trends, overbought/oversold conditions, or divergence.
Challenges #
Indicators are lagging; relying solely on them without price context can be misleading.
Trend Channel #
Trend Channel
Explanation #
Two parallel lines drawn to encapsulate price movement, defining a channel that reflects the prevailing trend.
Example #
A bullish trend channel on a daily chart slopes upward, containing price between $100 and $110.
Practical application #
Traders buy near the lower boundary and sell near the upper boundary, adjusting stops as the channel progresses.
Challenges #
Channel breaks may indicate trend reversal; monitoring for breakout is vital.
Triple Bottom #
Triple Bottom
Explanation #
A bullish reversal pattern featuring three lows at similar price levels, suggesting strong support.
Example #
An asset’s chart displayed three lows around $25, each separated by modest rallies.
Practical application #
Long positions may be entered after a break above the intervening high.
Challenges #
The pattern requires confirmation; a weak third low may invalidate the setup.
Triple Top #
Triple Top
Explanation #
A bearish reversal pattern with three peaks at a similar level, indicating strong resistance.
Example #
A cryptocurrency formed three peaks near $200 before falling back.
Practical application #
Short positions are taken after a break below the trough between peaks.
Challenges #
In strong uptrends, the pattern may fail; confirming with volume decline strengthens the signal.
Trendline Break #
Trendline Break
Explanation #
The event when price closes beyond a drawn trendline, suggesting a possible change in market direction.
Example #
A downtrend line was broken to the upside on a daily chart, indicating bullish momentum.
Practical application #
Breaks are often used as entry points, with stops placed near the broken line.
Challenges #
Trendlines can be subjective; false breaks are common in choppy markets.
Triangular Flag #
Triangular Flag
Explanation #
A short‑term consolidation that forms a triangle shape, typically after a strong price impulse, indicating a pause before continuation.
Example #
After a 7% rally, the price formed a narrowing triangle over several days before moving higher.
Practical application #
Traders may set entry orders above the triangle’s apex, targeting a move equal to the prior impulse.
Challenges #
The pattern can be confused with a pennant; confirming the prior impulse’s strength helps.
Volume Weighted Average Price (VWAP) #
Volume Weighted Average Price (VWAP)
Explanation #
The average price of an asset weighted by volume, recalculated throughout the trading day.
Example #
A stock’s VWAP on a given day was $45.30; price staying above VWAP indicated bullish bias.
Practical application #
Institutional traders use VWAP to gauge execution quality and set intraday support/resistance.
Challenges #
VWAP is intraday; it resets each day, limiting its usefulness for multi‑day analysis.
W‑Bottom #
W‑Bottom
Explanation #
A bullish reversal pattern with a “W” shape, consisting of two lows separated by a higher intermediate high.
Example #
A commodity’s chart formed a W‑bottom with lows at $30 and $28 and a peak at $33.
Practical application #
Long positions are entered after price breaks above the intermediate high, targeting the prior swing low distance.
Challenges #
The second low must be higher than the first; otherwise, the pattern may be a simple pullback.
W‑Top #
W‑Top
Explanation #
A bearish reversal pattern resembling a “W” upside down, with two highs separated by a lower intermediate low.
Example #
A stock’s chart showed peaks at $80 and $78 with a trough at $70, forming a W‑top.
Practical application #
Short positions are taken after price breaks below the intermediate low.
Challenges #
Similar to W‑bottom, the pattern requires clear formation and confirmation.
Weighted Moving Average (WMA) #
Weighted Moving Average (WMA)
Explanation #
A moving average that assigns greater weight to recent data points, making it more responsive than a simple moving average.
Example #
A 10‑period WMA reacts faster to price changes than a 10‑period SMA.
Practical application #
Used for quicker trend detection, often in conjunction with slower SMAs.
Challenges #
Higher sensitivity can increase false signals; balancing responsiveness and stability is key.
Williams %R #
Williams %R
Explanation #
A momentum indicator that measures the level of the close relative to the high‑low range over a set period, ranging from –100 (lowest) to 0 (highest).
Example #
A reading of –10 suggests the asset is near its high of the period.
Practical application #
Traders may consider buying when %R moves from oversold (< –80) toward zero, and selling when it retreats from overbought (> –20).
Challenges #
Like other oscillators, it can remain in extreme zones during strong trends, leading to premature exits.
Windowed Correlation #
Windowed Correlation
Explanation #
The calculation of correlation between two time series over a moving window, revealing how relationships evolve.
Example #
A 30‑day windowed correlation between gold and the US dollar index shows increasing negative correlation during inflationary periods.
Practical application #
Helps diversify portfolios and detect regime changes.
Challenges #
Choice of window size influences smoothness; too short yields noisy results, too long masks shifts.
Wedge Pattern #
Wedge Pattern
Explanation #
A chart pattern formed by two converging trendlines that slope either upward (rising wedge) or downward (falling wedge), indicating a potential reversal.
Example #
A falling wedge on a 15‑minute chart showed lower highs and lower lows converging, preceding a bullish breakout.
Practical application #
Traders may enter in the direction of the breakout, using the wedge’s apex as a stop‑loss reference.
Challenges #
Breakouts can be weak; confirming with volume and momentum improves confidence.
Whipsaw #
Whipsaw
Explanation #
A situation where price reverses direction shortly after a trade entry, causing a small loss and potentially eroding confidence.
Example #
A trader bought after a bullish flag breakout, only for price to reverse within two bars, resulting in a whipsaw.
Practical application #
Implementing tight stops and position sizing mitigates whipsaw impact.
Challenges #
Whipsaws are common in volatile markets; using filters and multiple confirmations reduces exposure.
Williams Accumulation Distribution (WAD) #
Williams Accumulation Distribution (WAD)
Explanation #
A cumulative indicator that assesses buying and selling pressure by comparing price movement to volume.
Example #
WAD rose despite price falling, indicating hidden accumulation.
Practical application #
Divergence between WAD and price can signal upcoming reversals.
Challenges #
Like other volume‑based tools, it can be misleading in low‑liquidity environments.
X‑Pattern #
X‑Pattern
Explanation #
A pattern formed by two intersecting trendlines that create an “X,” often indicating a sharp reversal after a prolonged move.
Example #
A stock’s chart showed an X‑pattern where a downtrend intersected an uptrend, followed by a rapid price swing.
Practical application #
The intersection point can serve as a pivot for trade entries.
Challenges #
Rare and subjective; careful validation with volume and other indicators is necessary.
Y‑Signal #
Y‑Signal
Explanation #
A visual cue on certain charting platforms indicating a potential trend shift, often displayed as a Y‑shaped marker where price crosses a moving average.
Example #
The platform plotted a Y‑signal when price crossed above the 200‑day SMA.
Practical application #
Used as a quick reference for trend changes, prompting further analysis.
Challenges #
Y‑signals are not universally available; reliance on them without corroboration can be risky.
Zigzag Indicator #
Zigzag Indicator
Explanation #
An indicator that filters out minor price movements, displaying only significant swings above a user‑defined threshold.
Example #
Setting a 5% threshold, the Zigzag highlighted major swings in a volatile stock.
Practical application #
Helps identify swing highs and lows for pattern analysis.
Challenges #
The indicator is non‑predictive; it only reflects past price action, so traders must combine it with forward‑looking tools.